
Dashboard
The dashboard is a web-based multi-node visualizer. It spawns firmware processes, connects to their simulation buses, and renders a live interactive canvas with GPIO state, UART traffic, ADC readings, SPI/I2C frames, and a wirable component canvas (LED, Button, POT).
It is completely decoupled from the C code: the firmware knows nothing about the
dashboard. The bridge is a Python asyncio process; the frontend is **Svelte 5
- Vite** — a compiled framework that ships pure vanilla JavaScript with no runtime in the browser (≈50 kB bundle).
Screenshots
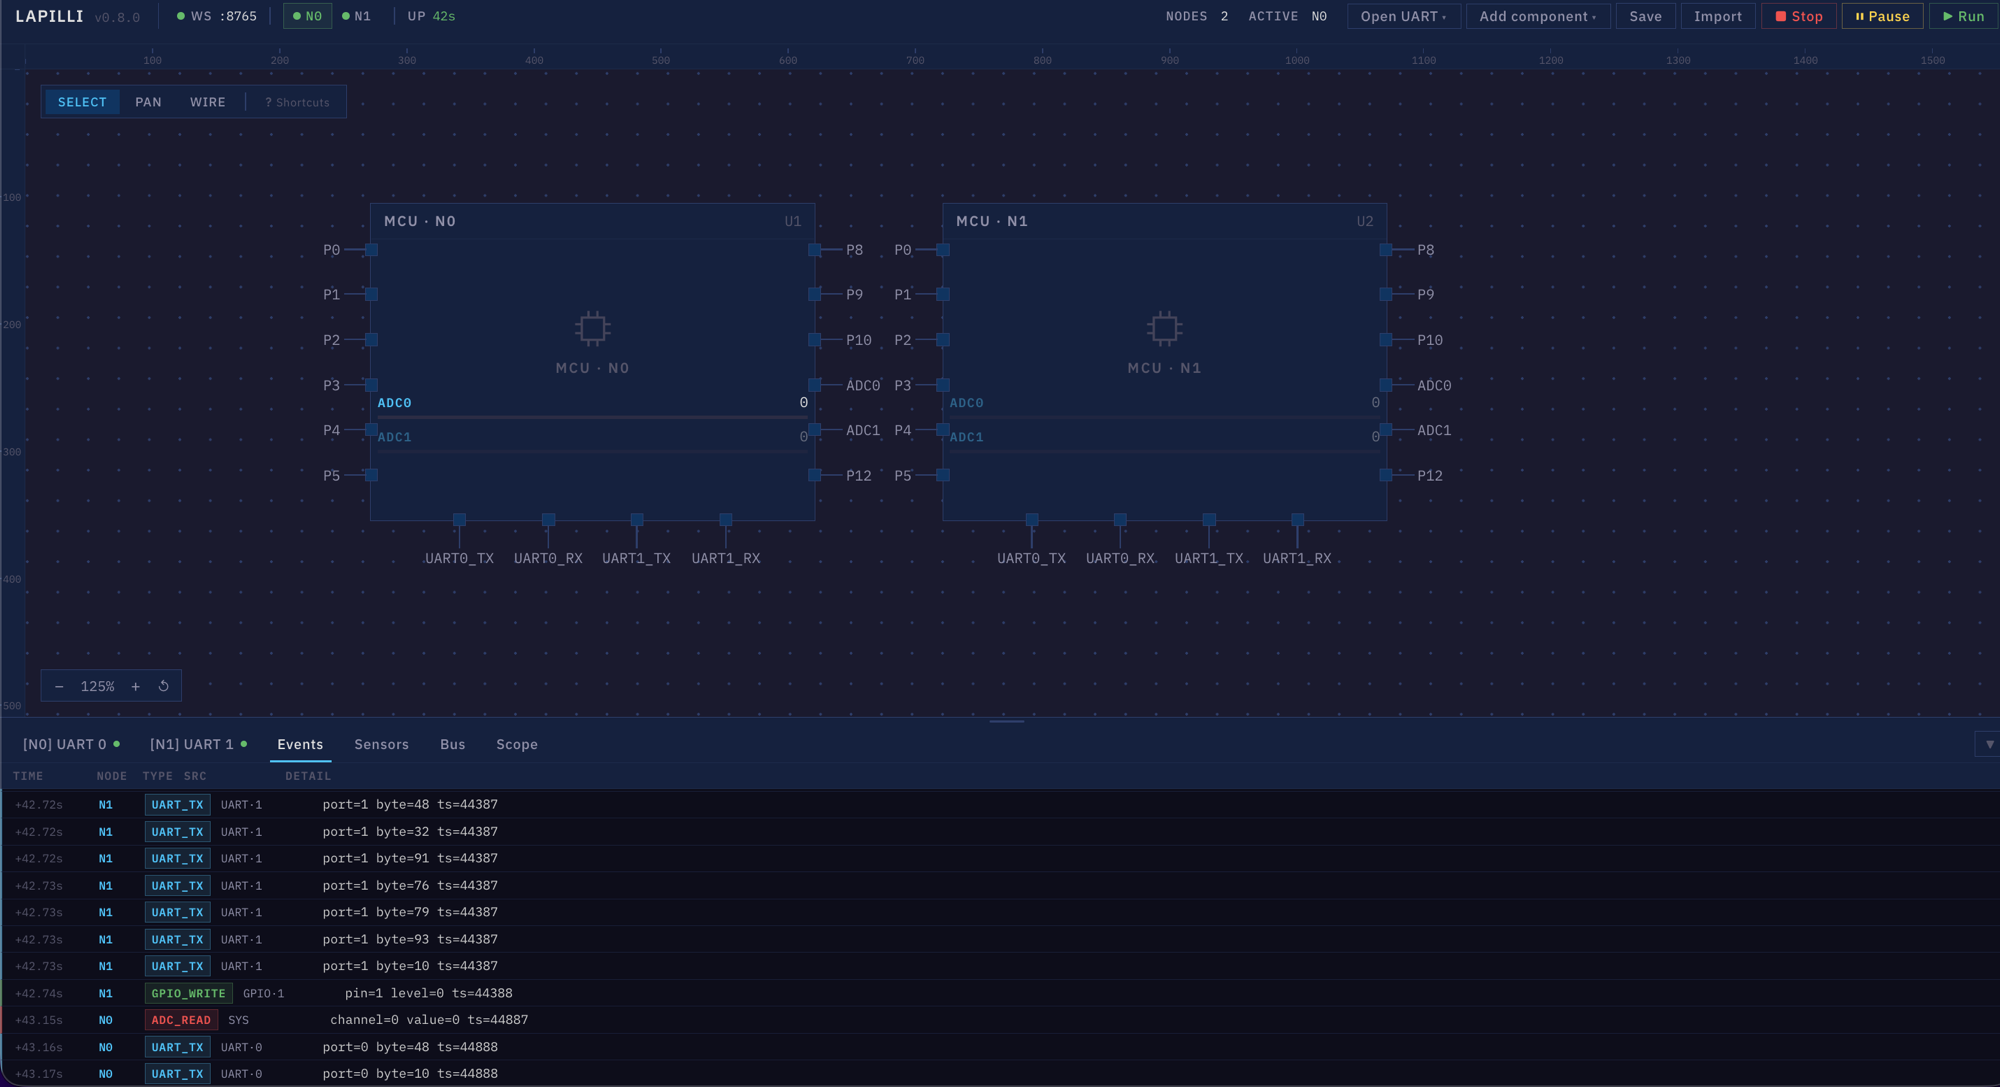
Section titled “Screenshots”Multi-node — two firmware instances running side by side, each with its own MCU card and live event stream (GPIO writes, ADC reads, UART traffic):
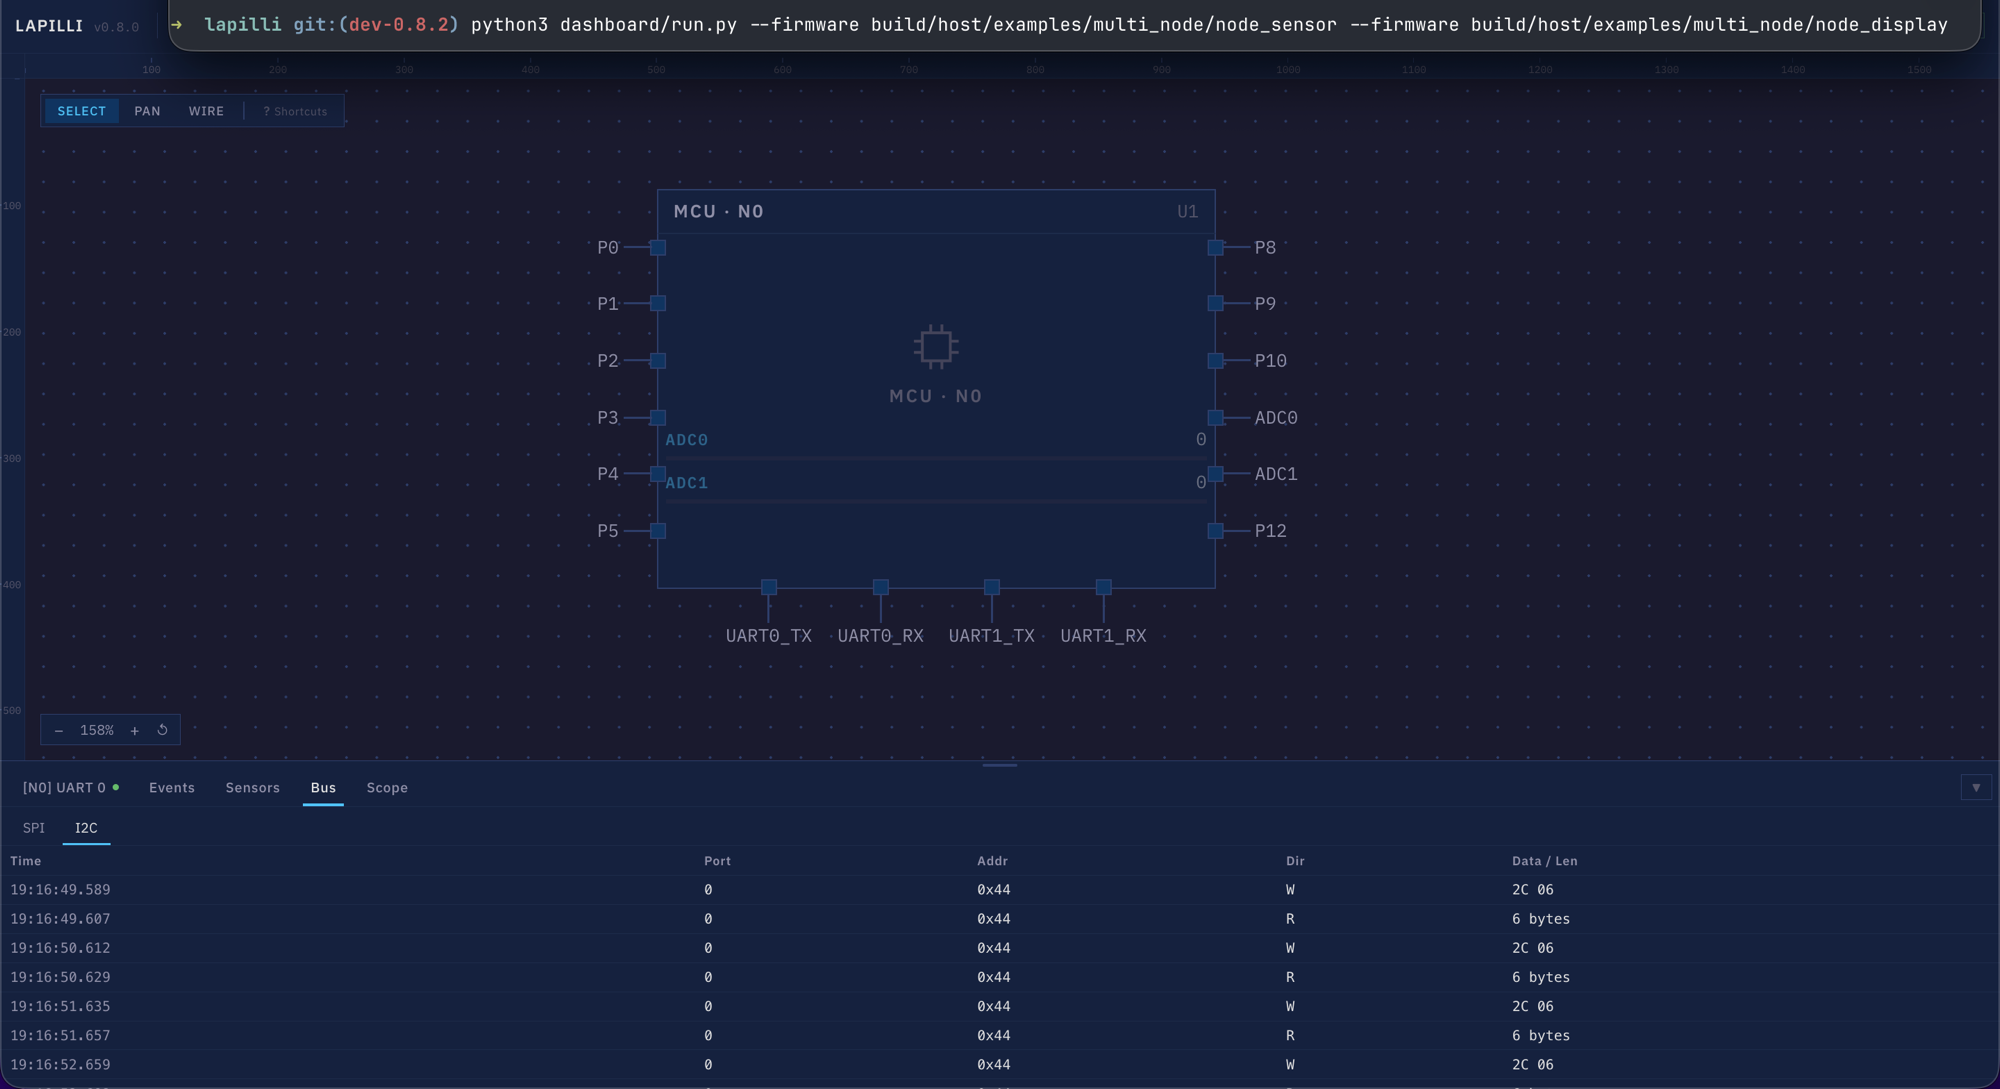
Single node with an I2C virtual device (SHT31) — the Bus panel shows real-time I2C transactions between the firmware and the simulated sensor:
Launch it
Section titled “Launch it”The simplest invocation builds the firmware, starts the bridge, serves the UI,
and opens a browser — all from one command. Ctrl+C shuts everything down
cleanly (the bridge terminates the firmware processes, then exits, then the dev
server stops).
# One node (sim_demo), opens the browser automaticallypython3 dashboard/run.py
# Same, without opening a browserpython3 dashboard/run.py --no-browser
# Force a rebuild before launchingpython3 dashboard/run.py --build
Multiple nodes
Section titled “Multiple nodes”# Two sim_demo instances side by sidepython3 dashboard/run.py --nodes 2
# Two different firmware binaries (the multi_node example)python3 dashboard/run.py \ --firmware build/host/examples/multi_node/node_sensor \ --firmware build/host/examples/multi_node/node_displayWith a virtual device
Section titled “With a virtual device”A virtual device answers the firmware’s SPI/I2C transactions in software, so no real sensor is needed:
# SPI thermocouple (MAX31855)python3 dashboard/run.py \  --firmware build/host/examples/spi_thermo/spi_thermo \  --device max31855 bus=spi port=0 cs=12
# I2C temperature + humidity sensor (SHT31)python3 dashboard/run.py \  --firmware build/host/examples/i2c_sht31/i2c_sht31 \  --device sht31 bus=i2c port=0 addr=0x44
Load a saved canvas
Section titled “Load a saved canvas”python3 dashboard/run.py --scene my_setup.jsonMake shortcuts
Section titled “Make shortcuts”From the dashboard/ directory:
make -C dashboard run # python3 run.pymake -C dashboard test # python3 -m pytestmake -C dashboard e2e # Playwright E2E suiteRunning the pieces manually
Section titled “Running the pieces manually”run.py is a thin launcher. You can drive the bridge and the frontend
separately:
# Bridge onlypython3 dashboard/bridge.py \  --firmware build/host/examples/sim_demo/sim_demo --port 8765
# Attach to an already-running firmware's socketpython3 dashboard/bridge.py --socket /tmp/lpl_sim_<pid>.sock --port 8765
# Frontend only (Vite dev server with HMR on http://localhost:5173)cd dashboard/uinpm installnpm run dev
What you see
Section titled “What you see”The browser UI has three zones:
- Header — brand, per-node connection status, and a toolbar (Run, Stop, Pause/Resume, Save, Import, Add component).
- Workspace — an interactive canvas with pan/zoom/drag. MCU cards and user components (LED, Button, POT, plus GND/VDD rails) can be wired together; wires drive component behavior.
- Bottom dock — a resizable dock with the UART console, the chronological event log, the ADC sensor panel (live injection sliders), the SPI/I2C bus panel, and the Scope tab (logic analyzer for GPIO + oscilloscope for ADC).
See the simulation bus reference for the protocol that feeds all of this.